Mesoscale dynamics and front-eddy interactions
Application to the Gulf of Mexico Loop Current SystemThe Loop Current (LC) is the only permanent current and the most energetic feature in the Gulf of Mexico. Once the LC reaches an advanced and unstable stage, a warm eddy sheds from the main current and moves southwestward. The shedding of the LC is very irregular, and its prediction is still very inaccurate. Nonetheless, it is known that cold-core, frontal eddies play an important role in the shedding as they can amplify and constrict the LC. These cold-core eddies form and grow through baroclinic instability in the LC’s vicinity. My research investigates the intensification of these frontal eddies and their interactions with the LC front and the surrounding flow.
Using a wide variety of datasets (mooring array, airborne CTDs, altimetry sea surface height, and submesoscale-resolving numerical model), I found that the growth of large frontal eddies can locally modify large-scale currents (the LC in this case) by intensifying eddy-current fronts at and below the surface, tilting isopycnals (~30% increase in horizontal density gradient), and bringing colder, deeper water to the surface (Hiron et al., 2020). A local increase in LC available potential energy is observed during frontal eddy growth. The intensification of these eddies also shift the balance of forces in the LC front from a geostrophic regime to a cyclostrophic regime – the centrifugal force becomes important (Hiron et al., 2021).
Additionally, frontal eddies also shape the surrounding circulation by attracting, during formation, offshore and onshore waters, facilitating cross-shelf exchange of water mass and chlorophyll. Once formed, these eddies can trap and transport water and passive tracers within their interior from the surface down to approximately 600 m for several weeks without exchange with their surroundings – a result that agrees with satellite observations of oil transport following the 2010 Deepwater Horizon oil rig explosion (Hiron et al., 2022).
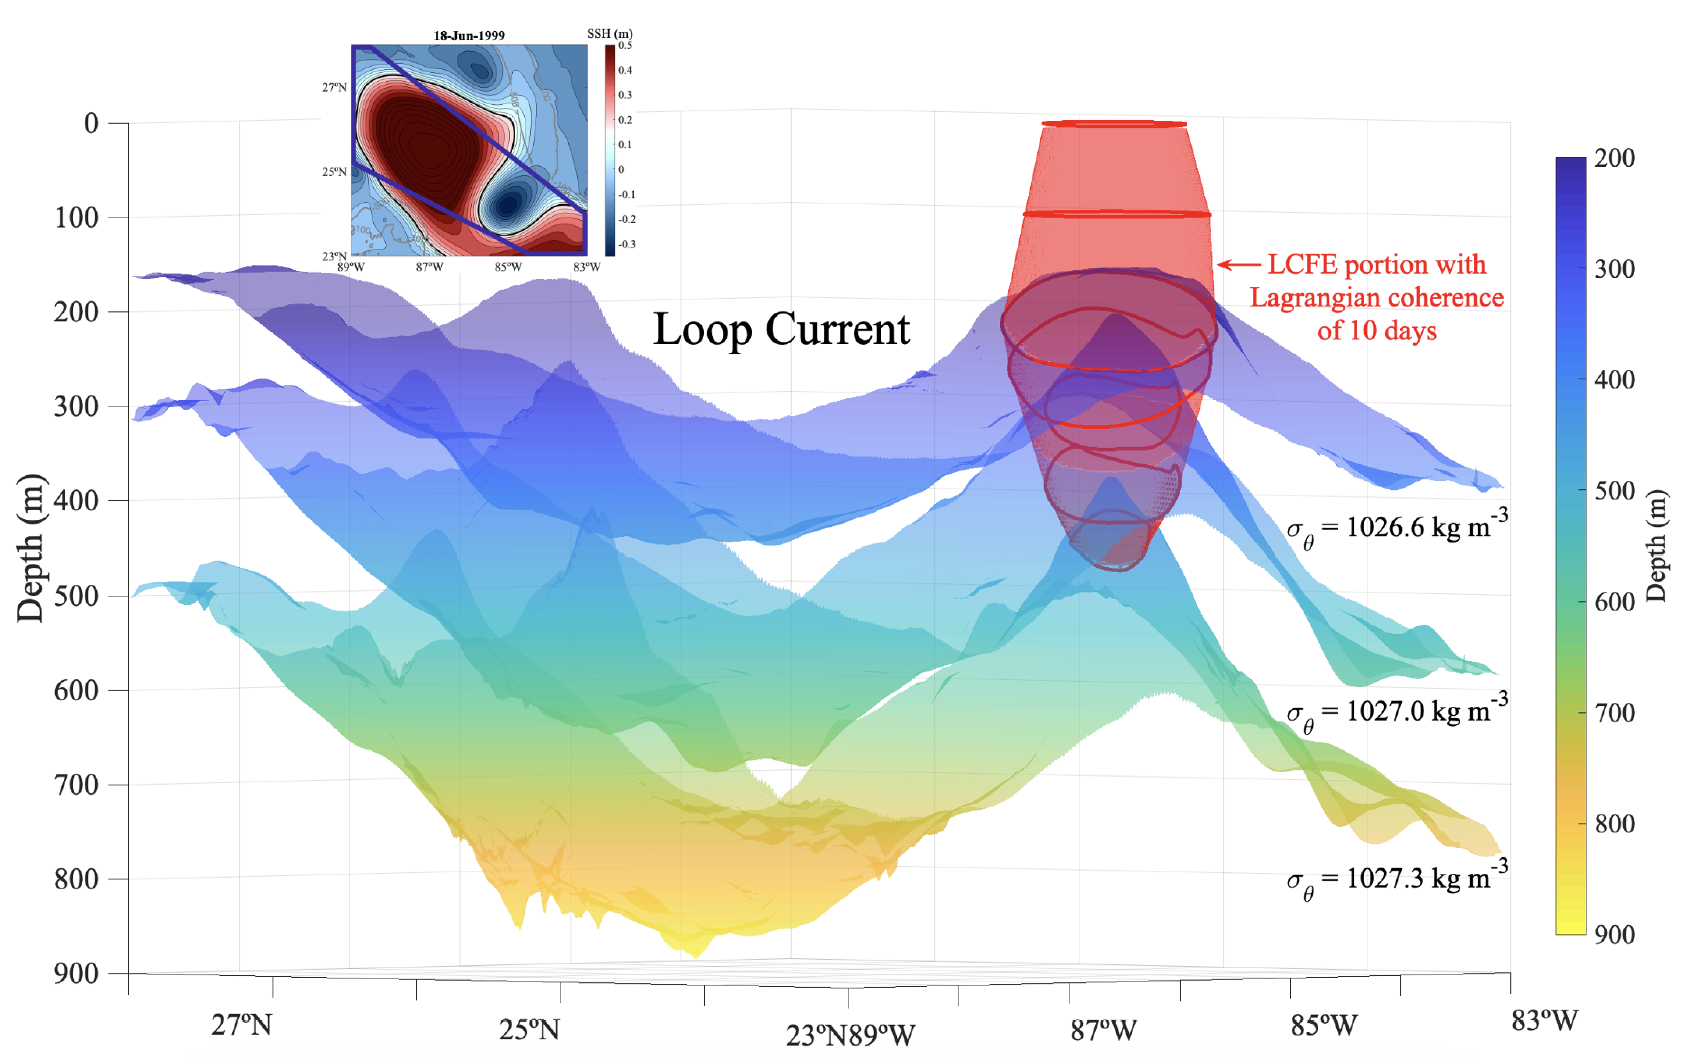 Figure 1. (Red object) Volume enclosing the LCFE Lagrangian coherent boundaries at different layers (red loops) for a time coherence of 10 days superposed to the depth of the isopycnal layers 23 (σθ = 1026.6 kg m-3), 25 (σθ = 1027.0 kg m-3), and 27 (σθ = 1027.3 kg m-3) for 18 June 1999 from the 1-km horizontal grid-spacing HYCOM simulation for the Gulf of Mexico. Source: Hiron et al. (2022).
 Figure 2. Sea surface height field (SSH) from altimetry for the Loop Current (LC) system, generated using E.U. Copernicus Marine Service Information, with the location of the particles (green dots) advected backward in time using altimetry geostrophic velocities for the LCFE that attracted and transported oil during the 2010 Deepwater Horizon oil spill. The yellow loops are the LCFE Lagrangian coherent boundaries plotted every 3 days, and the black diamond is the location of the Deepwater Horizon oil spill that exploded on 20 April 2010. The 100 m and 500 m isobaths are indicated by the solid gray lines. Source: Hiron et al. (2022).
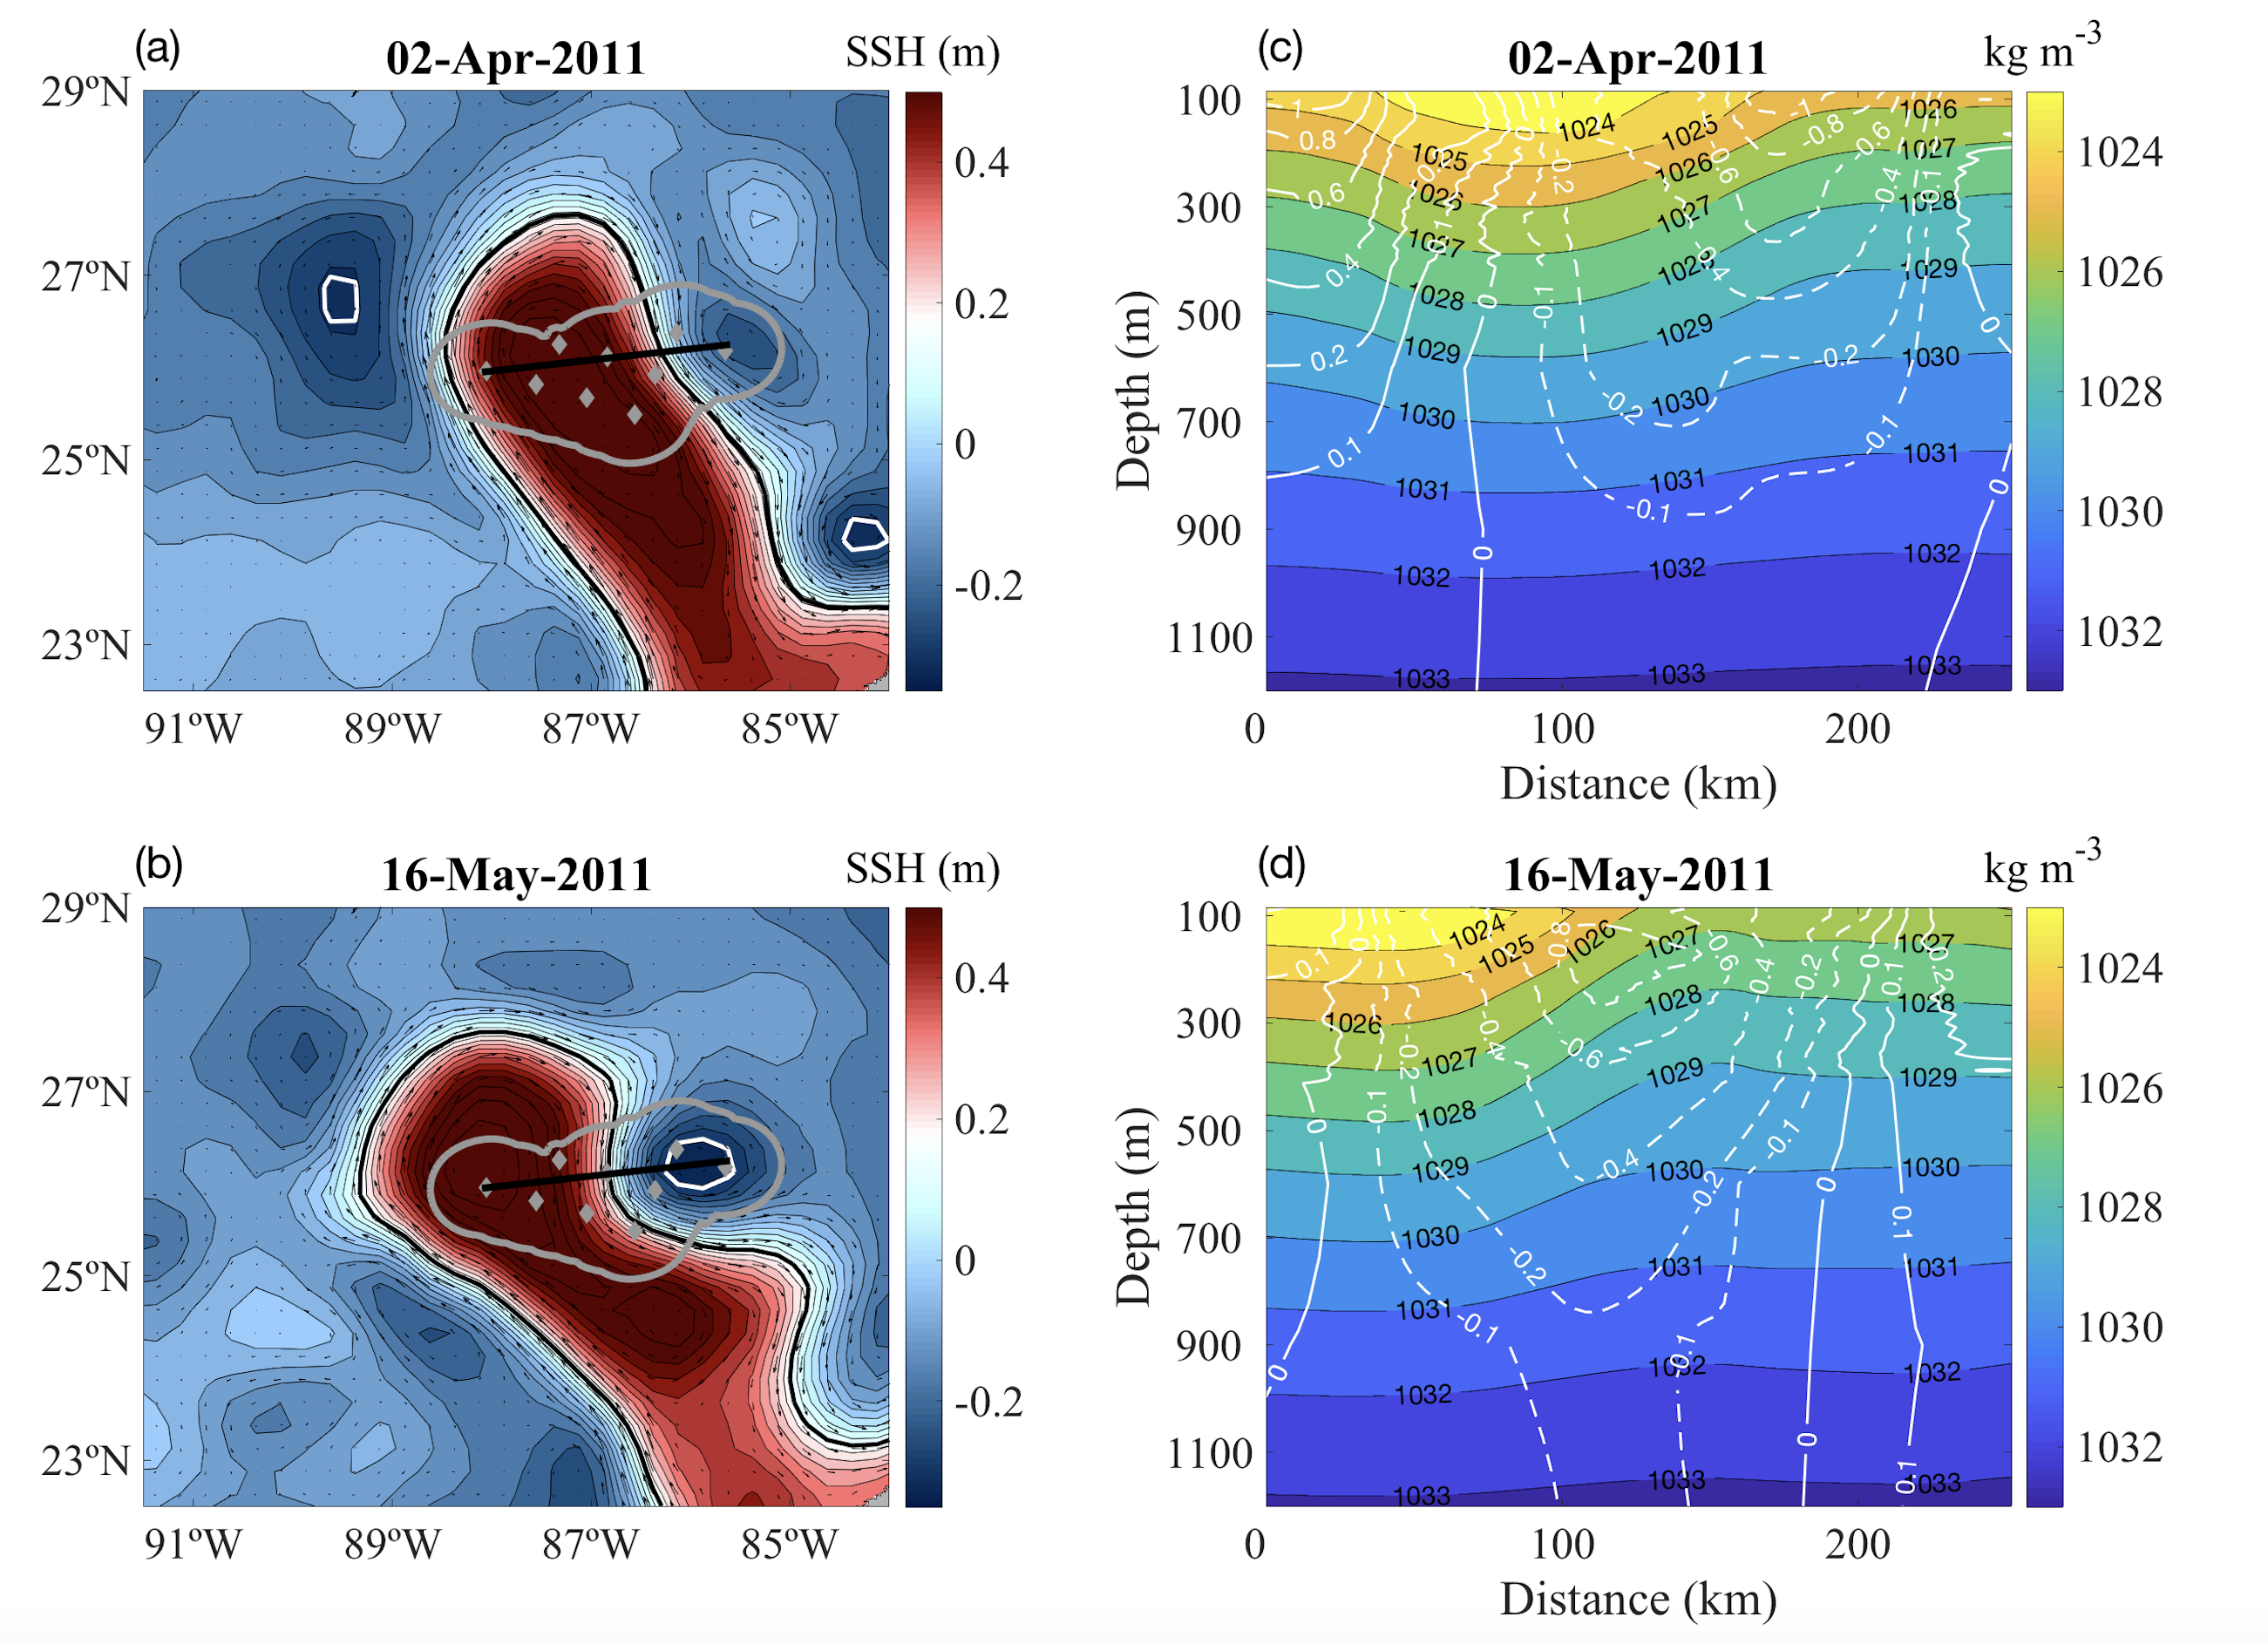 Figure 3. The frontal eddy intensification drives an increase in the density gradient and the flow strength in the LC-eddy front. (a) and (b) are the sea surface height field for the Loop Current System in a case with weak (02 April 2011) and intensified frontal eddy (16 May 2011). The gray dots and the thick gray line are the locations of the tall moorings (Lugo-Fernández, 2016; Hamilton et al., 2016) and the area where I applied an objective analysis. The black line shows the location of the cross-section. (c) and (d) shows a cross-section of the density filed and total velocity. The total velocity is represented by the white lines, dotted lines if flowing southeastward perpendicular to the cross-section, and solid lines if flowing northwestward. Source: adapted from Hiron et al. (2020).